Aim
The aim of the Norwegian life cycle assessment (LCA) food database was to compile a climate and environmental impact food database using available literature and database source data. The intended purpose for this data was to estimate representative levels of six environmental impact category (IC) values for foods in the Norwegian diet.
Challenges and limitations
There are several well-known limitations to compiling data from different published LCA studies and databases (Carvalho et al. 2023)(1). These include: high methodological heterogeneity across studies due to the flexibility in international standards; the evolution of these standards over time; and the use of assumptions, extrapolations, and substitutions for missing LCA data. We have discussed these limitations in detail in our method paper (Carlsen et al. 2025) and elaborate further in the following text.
Methodological framework of the original studies: in the compilation of the Norwegian LCA food database, we included LCA studies that had applied one of the life cycle impact assessment (LCIA) methods that were chosen for inclusion in the compilation project. As shown in the Table 1 below, most data were compiled from studies using the LCIA method ReCiPe 2016. However, for GWP, a notable proportion of values were obtained from studies using other methods than ReCiPe2016; 20% were based on the IPCC 2013 method, and 19% on other LCIA methods. The calculation of GWP in ReCiPe 2016 is based on the GWPs from the IPCC (2013) report (Steinmann & Huijbregts, 2016) and these methods are thereby more comparable than other LCIA methods. The variation in LCIA methods used in the source data is a limitation of the LCA food database, because IC values calculated using different LCIA methods are not directly comparable. However, the methodology applied in this compilation project is in line with recent projects that have compiled environmental impact databases for Chinese and European foods, respectively (Cai et al. 2022; Mertens et al. 2019).
Table 1 Percentages of impact category (IC) values compiled from sources using different life cycle impact assessment (LCIA) methods, in the Norwegian life cycle assessment (LCA) food database, version 01.
| Percentage IC values | |||||||
| LCIA method | GWP100 | EF | EM | ACID | WU | LU | Average |
| ReCiPe 2016 | 61 | 90 | 90 | 82 | 95 | 96 | 86 |
| IPCC 2013 | 20 | NAa | NA | NA | NA | NA | NA |
| IPCC 2007 | 6 | NA | NA | NA | NA | NA | NA |
| ILCD 2011 | 4 | 3 | 3 | 8 | 1 | NA | 4 |
| CML 2001 baseline | 3 | NA | NA | 3 | NA | 3 | NA |
| ReCiPe 2008 | 2 | 7 | 7 | 3 | 2 | 1 | 4 |
| Mixb | 2 | NA | NA | 1 | 2 | NA | NA |
| CML-IA | 1 | NA | NA | 1 | NA | NA | NA |
| CML 2 Baselinec | NA | NA | NA | 2 | NA | NA | NA |
GWP, global warming potential; EF, eutrophication freshwater; EM, eutrophication marine water; ACID, terrestrial acidification; WU, water use; LU, land use; NA, not applicable; aLCIA method not applicable to the impact category or no IC values identified with the particular LCIA method; bComposite dishes consisting of ingredients with different LCIA methods; cLCIA method was included if no other values were found. Table adapted form Carlsen et al 2025.
Allocation: The climate and environmental impact of foods with multiple byproducts should be allocated between the respective main and byproducts to prevent over- or underestimation of environmental load of the main versus the byproducts (Kytta et al. 2022). The choice of allocation method in LCAs is a key methodological choice by the LCA practitioners and greatly affects the results (Kytta et al. 2022, Svanes et al. 2011). In the present compilation project, most of the compiled data from original LCA studies or databases used economic allocation, see Table 2 adapted from Supplementary material 2 in Carlsen et al. 2025. However, for some foods, mass allocation or a mix of allocation methods was applied in the original studies. This introduced variation into the dataset. When using economic allocation, a higher share of the environmental footprint is often allocated to the products for human consumption (e.g., fish fillet) compared with mass allocation (Kytta et al. 2022, Svanes et al. 2011). In our project the IC values for four fish species (raw fillets of cod, salmon, mackerel and herring) were based on an LCA study using mass allocation, conducted for this project by SINTEF Ocean. These values may thus be dissimilar to values for other food groups in the database.
Table 2 Percentages of allocation methods used for the compiled impact category (IC) values in the Norwegian life cycle assessment (LCA) food database version 01
| Allocation method (%) | GWP100 | EF | EM | ACID | WU | LU | Average |
| Economic | 81 | 89 | 90 | 87 | 89 | 92 | 88 |
| No allocation | 8 | 4 | 2 | 4 | 2 | 1 | 4 |
| Mass | 5 | 3 | 3 | 4 | 5 | 3 | 4 |
| Mixeda | 5 | 4 | 4 | 4 | 4 | 4 | 4 |
GWP, global warming potential; EF, eutrophication freshwater; EM, eutrophication marine water; ACID, terrestrial acidification; WU, water use; LU, land use. aEconomic allocation and mass allocation or biophysical allocation in the original literature sources. Adapted from Carlsen et al. 2025.
Food waste is another factor that influences the environmental impact of foods. If the original sourced LCA data included food waste in their methodology, this was included in our data. Otherwise, we could not fill data gaps for food waste, due to lack of available data at the detailed level needed for compilation. These data gaps applied mainly to the retail and household lifecycle stages. Studies on food waste in Norway estimate that total food waste decreased by 12% in the period 2015 - 2019 and amounted to 417,000 tons of edible food in 2019 (Stensgård et al. 2020). Future versions of the Norwegian LCA food database should strive to fill food waste data gaps.
Quality assessment and representative data: an important initial stage of this comprehensive compilation project was to develop a quality assessment procedure for assessing of LCA articles (see Carlsen et al. 2025). This was developed to facilitate informed decision making when selecting LCA-studies from which to compile LCA values. The literature searches produced only a limited number of published LCA studies with IC values for Norwegian produce. Since an important aim of this project was to compile a database with representative LCA data for the Norwegian market, we prioritized LCA data from Norwegian studies if they passed the quality assessment. This meant that a few Norwegian LCA studies were the basis for most of the LCA values for Norwegian produce, such as meat, dairy and cereals. Too few studies and data points existed to estimate average values or to estimate the uncertainty range. Weighted average values were estimated for those food codes of generic food items in the database that constitute both imported and Norwegian produce. The weighted averages were based on the percentages of domestic production and imports for each food item/ food group, as sourced from Norwegian market share information, described in Supplementary material 2 in Carlsen et al. 2025.
The generic overall system boundaries were defined from farm to fork, i.e., including production (farm/fisheries), transport, processing, storage, retail and consumer stages. The functional unit was set as 100 g of food item as eaten. This is the standard unit for presenting food composition, nutrient concentrations and other food components in food composition databases (Greenfield and Southgate, 2003). As far as possible, the LCA studies from which we compiled data had the same system boundaries as those defined in the compilation project. If not, missing data were imputed, based on literature, other LCA databases and estimations in SimaPro software, see paragraph about data gaps below. Nonetheless, while the compilation project strived to cover system boundaries from farm to fork and sought to include LCA studies with wide system boundaries, the final database is comprised of values with both narrow and wide system boundaries, depending on the available data.
Data gaps in the original sourced LCA literature are a common challenge faced in LCA studies (Zargar et al. 2022). This increases the variability of the impact data. Many of the original LCA studies investigated the environmental impacts of food production only to farm gate, omitting the rest of the value chain. This is valid from a production perspective but incomplete from a consumption perspective. The present compilation project strived to close all data gaps to obtain values for food items as eaten; this is described in detail in our method paper (Carlsen et al. 2025). However, due to the challenges described above, this was not possible in practice. The final database reflects the available, quality assessed, and representative LCA data in the scientific literature at the time, and available data from other environmental databases (RIVM, Agri-Footprint, EcoInvent), adapted to the Norwegian context.
Variation in IC values published from different LCA studies and LCA databases over time
In a newly published paper, Carvalho et al 2023 assessed the effect of applying LCA data from different publicly accessible databases to the same individual food consumption data from Portugal. They observed that using different LCA food databases led to diverse estimates for common indicators when linked to the same food consumption data. As an example, GHGE was estimated to the following based on three LCA food databases (P50 (P25–P75)); the SHARP-ID database 4.42(3.44–5.64) kg CO2eq, Poore & Nemecek database 6.17(4.46–8.41) kg CO2eq, and SU-EATABLE LIFE database 5.64(4.26–7.36) kg CO2eq. However, except for water footprints, most indicators from the databases were highly correlated with each other, with meat and other animal-based foods as the top contributors (Carvalho et al. 2023). When interpreting these comparisons, it can be challenging to assess whether these are real differences, or whether the observed differences are due to the methodological variations and challenges discussed above. Therefore, it can be difficult to distinguish between what is a genuine difference (e.g., between food groups and between foods from different geographical regions) and what is a result of methodological inconsistencies.
To examine variations in IC values across LCA sources, we estimated the environmental impacts of 100 g edible food from farm to fork for food items important in the Norwegian consumption pattern, using several different LCA sources. The comparisons are presented in Figures 1-6 below. To be clear, these values may not be part of the Norwegian Food LCA database, but are included here to highlight variation across seemingly comparable values. The values presented below were calculated with the LCIA methods ReCiPe 2016; 2008, and IPCC 2021;2013; 2007. Additionally, economic allocation was used unless indicated otherwise in the figures. We used a variety of LCA sources, and missing life cycle stages were filled with proxy data. For dairy beef, two data sources were available in Agri-Footprint 4.0, labelled with (a) and (b) in the figures to differentiate the values.
For GWP (Figure 1), there were variations in LCA values across most food groups. The values for wheat flour, milk and chicken were overall quite similar. Values from Møller & Samsonstuen (2024) were high for both sheep, lamb and dairy beef. For sheep and lamb, there was large variation between all values, and of note, the value from RIVM (2019) was removed in the updated RIVM 2024 version, which may suggest significant uncertainty with the estimate in the 2019 database. For pork, the values from Johansen & Hjelkrem (2018) were estimated for both narrow and wide system boundaries, see Figure 1.

For freshwater eutrophication (Figure 2), there were variations in LCA values across all food groups. For several food groups, differences between the highest and lowest LCA values were nearly ten-fold. Most noteworthy is the value for dairy beef from Møller & Samsonstuen (2024), which we speculate may be due to the allocation method. For cheese and milk, the value for freshwater eutrophication changed considerably from RIVM 2019 to the 2024 version. As shown in the figure, the updated RIVM (2024) value for milk is more similar to the value from Svanes (2019).

Large variations across sources were found for marine eutrophication (Figure 3). Most notably, a high value for sheep and lamb from RIVM (2019), which was subsequently removed in the 2024 version of the database (RIVM 2024). Also, the marine eutrophication value for wheat flour from Svanes (2019) was very low compared to the rest of the studies presented here for comparison.

For terrestrial acidification, the largest differences were seen for estimates for sheep and lamb, with the RIVM (2019) value being particularly high. In contrast, the updated value from RIVM 2024 is the lowest value for several food groups.

For water consumption, all values were calculated using ReCiPe 2016. Still, there was variation across groups. The highest estimates for most foods came from Svanes (2019), who present a considerably higher estimate for cheese than seen in other studies.

Similarly to the other environmental impacts, LCA estimates also varied for land use. For sheep and lamb, the values were especially varied, most notably the high value from Svanes (2019). The difference between the two RIVM database versions with regard to land use was less than for the other environmental impacts presented in this comparison.
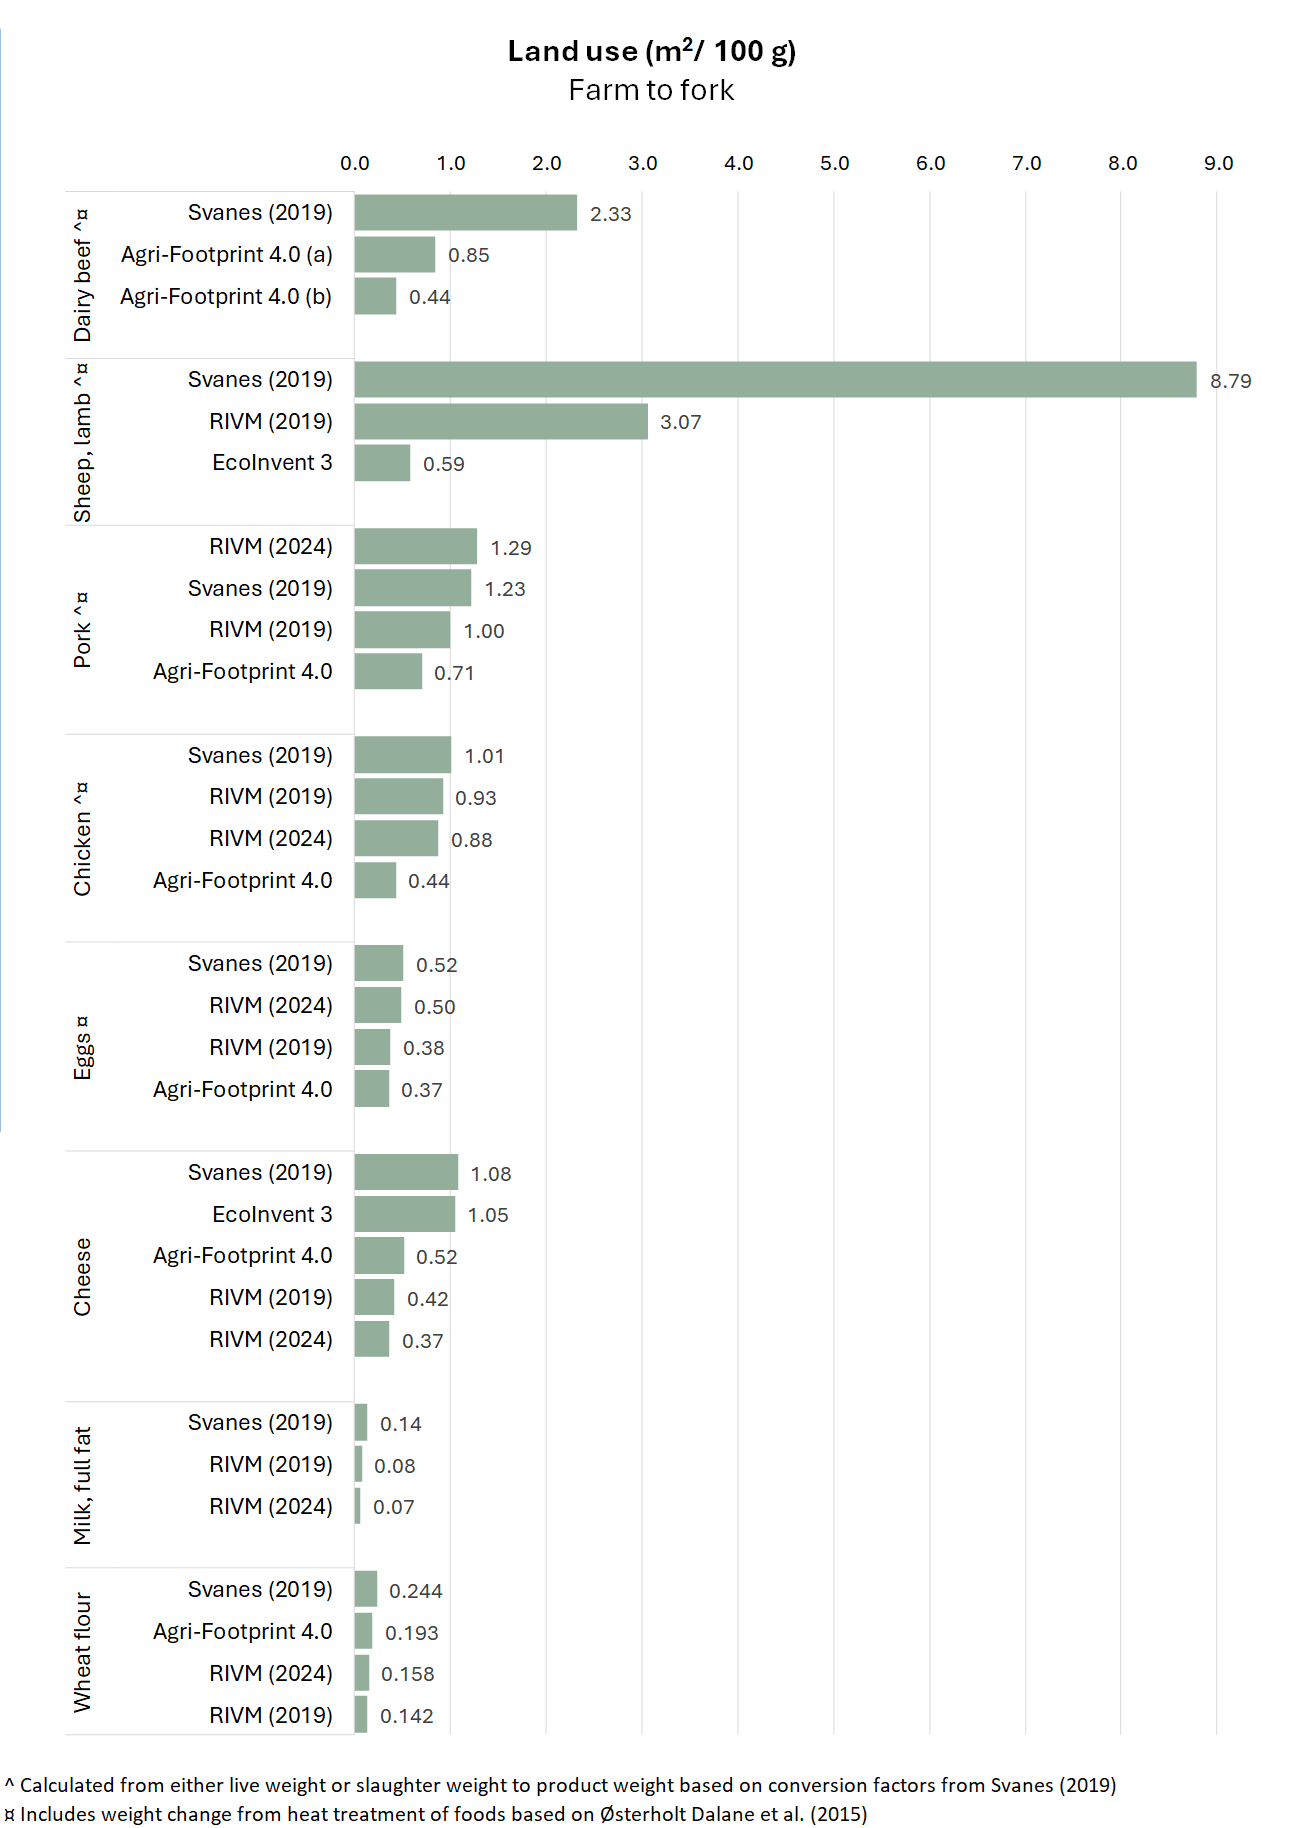
In summary, LCA results varied substantially across LCA sources for all environmental impacts. The highest amount of variation was seen for marine eutrophication, whereas global warming potential were more similar. The results for sheep and lamb and dairy beef were highly variable across multiple environmental impacts, suggesting larger uncertainty for these foods.
Notably dissimilar values include the water use estimate for cheese and marine eutrophication estimate for wheat flour from Svanes (2019), the global warming potential of dairy beef based on Møller & Samsonstuen’s (2024), and several RIVM (2019) values for sheep and lamb. The difference between RIVM databases versions 2019 and 2024 also illustrate that there can be appreciable differences in LCA estimates over time.
Updating the Norwegian LCA food database version 1.0 to a new version 1.1
Based on a thorough evaluation of food groups central to the Norwegian diet, and variations in IC values across LCA sources (exemplified by Figures 1-6 above), we have decided to exclude the ICs marine eutrophication from the Norwegian database version 1.0, and in the following we present the updated version 1.1, see below. In addition, in version 1.1. all IC values for sheep/lamb are removed. Version 1.1 also includes various smaller updates; re-estimation of water use in cheese, and a small adjustment of full-fat milk, based on new data on packaging. IC values for sheep/lamb may be reintegrated into the database if new, representative and robust LCA data becomes available.
Continued updates of LCA databases are necessary, also in light of the fact that all parts of the food system are under discussion for change towards more sustainable food production.
Despite the overall limitations associated with LCA food databases, we believe that the present Norwegian LCA food database is an important contribution to the research field. However, when employing LCA data and comparing values across food groups, studies and databases, it is crucial to understand the compilation process and be aware of relevant limitations
The Norwegian LCA food database version 1.1
The IC food values are presented in 8 food groups, with the following impact categories:
- GWP100, global warming potential, kg CO2/100 g
- EF, freshwater eutrophication, kg P/100g
- ACID, terrestrial acidification, kg SO2/100g
- WU, water use, m3/100g
- LU, land use, m2/100g
Table 1 Beverages per 100 g.
| Food item | GWP100, kg CO2 | EF, kg P | ACID, kg SO2 | WU, m3 | LU, m2 |
| Apple juice | 0,066 | 0,00002 | 0,00027 | 0,006 | 0,028 |
| Beer | 0,065 | 0,00001 | 0,00033 | 0,001 | 0,023 |
| Bottled water | 0,032 | <0,001 | 0,00007 | 0,001 | 0,001 |
| Coffee, filter | 0,074 | 0,00001 | 0,00030 | 0,001 | 0,040 |
| Liquor | 0,280 | 0,00007 | 0,00077 | 0,005 | 0,009 |
| Orange juice | 0,187 | 0,00002 | 0,00065 | 0,046 | 0,055 |
| Soda | 0,032 | <0,001 | 0,00007 | 0,001 | 0,001 |
| Tap water | 0,000 | <0,001 | 0,00000 | <0,001 | 0,000 |
| Tea | 0,013 | 0,00001 | 0,00055 | 0,004 | 0,021 |
| Wine | 0,230 | 0,00002 | 0,00142 | 0,004 | 0,122 |
Table 2 Dairy products per 100 g.
| Food item | GWP100, kg CO2 | EF, kg P | ACID, kg SO2 | WU, m3 | LU, m2 |
| Milk, whole fat | 0,1549 | 0,00004 | 0,00233 | 0,00345 | 0,14076 |
| Butter | 1,0430 | 0,00017 | 0,01689 | 0,01740 | 1,08401 |
| Cheese | 1,1998 | 0,00029 | 0,01889 | 0,03505 | 1,08401 |
| Yoghurt | 0,1799 | 0,00005 | 0,00231 | 0,00379 | 0,12569 |
Table 3 Fish and seafood per 100 g.
| Food item | GWP100, kg CO2 | EF, kg P | ACID, kg SO2 | WU, m3 | LU, m2 |
| Caviar, Norwegian style | 0,16393 | 0,0000334 | 0,0013352 | 0,002 | 0,113408 |
| Cod, boiled | 0,281133 | 0,0000626 | 0,0010562 | 0,004 | 0,0047855 |
| Cod, raw | 0,1680521 | 0,0000371 | 0,0006314 | 0,002 | 0,0028354 |
| Fish patties, cooked | 0,1703499 | 0,0000337 | 0,0011665 | 0,009 | 0,0482368 |
| Haddock, boiled | 0,281133 | 0,0000626 | 0,0010562 | 0,003 | 0,0047855 |
| Haddock, raw | 0,1680521 | 0,0000371 | 0,0006314 | 0,002 | 0,0028354 |
| Herring, boiled | 0,1083618 | 0,0000293 | 0,0003996 | 0,004 | 0,0074969 |
| Herring, raw | 0,0901451 | 0,0000239 | 0,0003324 | 0,003 | 0,0062472 |
| Mackerel, boiled | 0,134461 | 0,0000248 | 0,0004294 | 0,003 | 0,0021056 |
| Mackerel, raw | 0,1120684 | 0,0000202 | 0,0003574 | 0,001 | 0,0017185 |
| Saithe, boiled | 0,281133 | 0,0000626 | 0,0010562 | 0,004 | 0,0047855 |
| Saithe, raw | 0,1680521 | 0,0000371 | 0,0006314 | 0,002 | 0,0028354 |
| Salmon farmed, raw | 0,6596598 | 0,0001825 | 0,0028361 | <0,001 | 0,4013565 |
| Salmon farmed, boiled | 0,7863555 | 0,0002181 | 0,0033802 | 0,001 | 0,4778652 |
| Shrimps, cooked | 1,5496594 | 0,0006712 | 0,0041063 | 0,009 | 0,2154191 |
Table 4 Fruit, berries, nuts and seeds per 100 g.
| Food item | GWP100, kg CO2 | EF, kg P | ACID, kg SO2 | WU, m3 | LU, m2 | |
| Almonds | 0,519 | 0,00007 | 0,0062 | 0,438 | 0,746 | |
| Apples | 0,071 | 0,00004 | 0,0004 | 0,007 | 0,024 | |
| Cashewnuts | 0,457 | 0,0003 | 0,0070 | 0,200 | 1,395 | |
| Grapes | 0,130 | 0,00004 | 0,0007 | 0,012 | 0,031 | |
| Hazelnuts | 0,431 | 0,0001 | 0,0034 | 0,162 | 1,128 | |
| Lemon | 0,192 | 0,00002 | 0,0009 | 0,020 | 0,056 | |
| Linseed | 0,199 | 0,00005 | 0,0016 | 0,013 | 1,178 | |
| Mango | 0,191 | 0,00002 | 0,0006 | 0,037 | 0,070 | |
| Orange | 0,102 | 0,00001 | 0,00049 | 0,014 | 0,030 | |
| Peanuts | 0,767 | 0,00002 | 0,0008 | 0,018 | 0,597 | |
| Pears | 0,087 | 0,00001 | 0,0003 | 0,018 | 0,012 | |
| Walnuts | 0,157 | 0,00004 | 0,0010 | 0,039 | 0,347 | |
Table 5 Grains and grain products per 100 g.
| Food item | GWP100, kg CO2 | EF, kg P | ACID, kg SO2 | WU, m3 | LU, m2 |
| Oat grain | 0,120 | 0,00003 | 0,0008 | 0,001 | 0,269 |
| Wheat grain | 0,128 | 0,00005 | 0,0011 | 0,001 | 0,223 |
| Pasta, cooked | 0,048 | 0,00001 | 0,0006 | 0,046 | 0,074 |
| Rice, cooked | 0,214 | 0,00001 | 0,0011 | 0,016 | 0,046 |
| Biscuit* | 0,317 | 0,00004 | 0,0015 | 0,005 | 0,238 |
| Bread* | 0,101 | 0,00004 | 0,0006 | 0,002 | 0,194 |
| Chocolate cake* | 0,250 | 0,00006 | 0,00262 | 0,021 | 0,262 |
*estimated from recipes of composite dishes
Table 6 Meat, poultry and egg per 100 g.
| Food item | GWP100, kg CO2 | EF, kg P | ACID, kg SO2 | WU, m3 | LU, m2 |
| Beef, cooked | 3,662 | 0,0008 | 0,0578 | 0,044 | 4,680 |
| Beef, raw | 2,563 | 0,0006 | 0,0405 | 0,030 | 3,276 |
| Meatballs, beef & pork, cooked | 1,110 | 0,0003 | 0,0147 | 0,028 | 1,517 |
| Pork, cooked | 0,558 | 0,0001 | 0,0029 | 0,019 | 1,347 |
| Pork, raw | 0,453 | 0,0001 | 0,0024 | 0,014 | 1,096 |
| Sausage (pork and beef), heat-treated | 0,577 | 0,0001 | 0,0052 | 0,016 | 1,113 |
| Sausage (pork and beef), raw | 0,575 | 0,0001 | 0,0052 | 0,015 | 1,113 |
| Chicken meatballs, cooked | 0,419 | 0,0002 | 0,0035 | 0,014 | 0,682 |
| Chicken, whole, cooked | 0,560 | 0,0003 | 0,0060 | 0,022 | 1,058 |
| Chicken, whole, raw | 0,447 | 0,0003 | 0,0048 | 0,018 | 0,845 |
| Sausage (chicken), heat-treated | 0,256 | 0,0002 | 0,0026 | 0,011 | 0,465 |
| Sausage (chicken), raw | 0,255 | 0,0002 | 0,0026 | 0,010 | 0,465 |
| Egg, boiled | 0,279 | 0,0002 | 0,0044 | 0,041 | 0,672 |
| Egg, fried | 0,321 | 0,0002 | 0,0051 | 0,047 | 0,772 |
| Egg, raw | 0,245 | 0,0001 | 0,0039 | 0,035 | 0,591 |
Table 7 Vegetables, legumes and vegetable products per 100 g.
| Food item | GWP100, kg CO2 | EF, kg P | ACID, kg SO2 | WU, m3 | LU, m2 |
| Avocado | 0,204 | 0,00005 | 0,0011 | 0,062 | 0,103 |
| Beans, canned | 0,173 | 0,00004 | 0,0011 | 0,007 | 0,209 |
| Broccoli, raw | 0,052 | 0,00002 | 0,0003 | 0,06 | 0,023 |
| Carrot, boiled | 0,033 | <0,00001 | 0,0002 | 0,004 | 0,023 |
| Carrot, raw | 0,032 | <0,00001 | 0,0001 | 0,004 | 0,023 |
| Chickpeas (soaked, not dry) | 0,147 | 0,00004 | 0,0002 | 0,005 | 0,491 |
| Cucumber | 0,216 | 0,00005 | 0,0006 | 0,022 | 0,008 |
| Leek | 0,022 | <0,00001 | 0,0001 | 0,004 | 0,024 |
| Lentils (soaked, not dry) | 0,107 | 0,00025 | 0,0001 | 0,002 | 0,534 |
| Lettuce | 0,074 | 0,00001 | 0,0005 | 0,005 | 0,056 |
| Maize | 0,214 | 0,00002 | 0,0033 | 0,072 | 0,179 |
| Onion | 0,028 | 0,00001 | 0,0001 | 0,004 | 0,020 |
| Paprika | 0,413 | 0,00002 | 0,0003 | 0,021 | 0,010 |
| Peas | 0,146 | 0,00004 | 0,0002 | 0,004 | 0,491 |
| Potato, raw | 0,031 | 0,00002 | 0,0002 | 0,004 | 0,043 |
| Tofu | 0,465 | 0,00003 | 0,0006 | 0,005 | 0,224 |
| Tomato | 0,157 | 0,00002 | 0,0003 | 0,004 | 0,009 |
| Vegetarian meat burger analogue | 0,409 | 0,00002 | 0,0007 | 0,004 | 0,181 |
| Vegetarian minced meat analogue | 0,476 | 0,00001 | 0,0017 | 0,010 | 0,337 |
| Vegetarian sausage analogue | 0,545 | 0,00004 | 0,004 | 0,011 | 0,541 |
| Zucchini, squash | 0,301 | 0,00002 | 0,0006 | 0,013 | 0,040 |
Table 8 Margarine, chocolate, condiment, sugar per 100 g.
| Food item | GWP100, kg CO2 | EF, kg P | ACID, kg SO2 | WU, m3 | LU, m2 |
| Margarine | 0,214 | 0,00006 | 0,00375 | 0,008 | 0,410 |
| Chocolate | 0,624 | 0,00015 | 0,00617 | 0,006 | 0,648 |
| Ketchup | 0,158 | 0,00003 | 0,00061 | 0,011 | 0,077 |
| Sugar | 0,209 | 0,00003 | 0,00098 | 0,001 | 0,076 |
References
Agrifootprint van Paassen M, Braconi N, Kuling L, Durlinger B, Gual P. Agri-footprint 5.0. Part 1: methodology and basic principles. Gouda: Blonk Consultants; 2019.
Cai H, Biesbroek S, Wen X, Fan S, van’t Veer P, Talsma EF. Environmental footprints of Chinese foods and beverages: literature-based construction of a LCA database. Data Brief 2022; 42: 108244. doi: 10.1016/j.dib.2022.108244
Carvalho et al. Assessing the environmental impact of diet – Influence of using different databases of foods’ environmental footprints. J Cleaner Production 2023, 416: 137973. https://doi.org/10.1016/j.jclepro.2023.137973
Carlsen et al. Environmental impact of Norwegian food and beverages: compilation of a life cycle assessment food database. Food & Nutrition Research 2025, 69:10645. - http://dx.doi.org/10.29219/fnr.v69.10645
Ecoinvent Moreno Ruiz E, Valsasina L, FitzGerald D, Brunner F, Symenoidis A, Bourgault G, et al. Documentation of changes implemented in the EcoInvent Database v3.6. Zürich: EcoInvent Association; 2019.
Greenfield H and Southgate DAT. Food composition data. Production, managment and use. Rome: Food and Agricultural Organization of the United Nations; 2003.
Kytta V, Roitto M, Astaptsev A, Saarinen M, Tuomisto HL. Review and expert survey of allocation methods used in life cycle assessment of milk and beef. Int J Life Cycle Ass 2022; 27(2): 191–204. doi: 10.1007/s11367-021-02019-4
Mertens E, Kaptijn G, Kuijsten A, van Zanten H, Geleijnse JM, van’t Veer P. SHARP-indicators database towards a public database for environmental sustainability. Data Brief 2019; 27: 104617. doi: 10.1016/j.dib.2019.104617
RIVM The National Institute for Public Health and the Environment. LCA food database. 2021. Available from: https://www.rivm.nl/ voedsel-en-voeding/duurzaam-voedsel/database-milieubelasting-voedingsmiddelen [cited 20 June 2019].
Stensgård AE, Prestrud K, Callewaert P. Matsvinn i Norge – Rapportering av Nøkkeltall 2015–2019. Fredrikstad: NORSUS; 2020.
Steinmann, Z. J. N. & Huijbregts, M. A. J., (2016) Climate change. In: Huijbregts, M. A. et al. (eds.) ReCiPe 2016: A harmonized life cycle impact assessment method at midpoint and endpoint level Report I: Characterization. National Institute of Public Health and the Environment. Ministry of Health, Welfare and Sport. RIVM report 2016-0104.
Svanes E, Vold M, Hanssen OJ. Effect of different allocation methods on LCA results of products from wild-caught fish and on the use of such results. Int J Life Cycle Ass 2011; 16(6): 512–21. doi: 10.1007/s11367-011-0288-4
Zargar S, Yao Y, Tu QS. A review of inventory modeling methods for missing data in life cycle assessment. J Ind Ecol 2022; 26(5): 1676–89. doi: 10.1111/jiec.13305