Abstract
Introduction: Liver sinusoidal endothelial cells (LSEC) are specialized endothelial cells with unique metabolic and barrier functions adapted to the needs of the liver sinusoid. LSECs are highly sensitive to their environment, and this fragile nature causes challenges in analyzing their phenotype under in vitro conditions.
Methods: In this work, we first differentiated LSEC-like cells (scLSECs) from two human pluripotent stem cell lines and characterized them by a panel of qPCR markers, immunohistochemistry, substrate oxidation for energy metabolism, scavenger function, and nitric oxide secretion. We then introduced holotomography, a technique that allows to recover quantitative and three-dimensional information about the refractive indexes of cell components, as a tool to image and track scLSEC in vitro in a minimally intrusive, label-free manner.
Results and discussion: Holotomography and developed machine learning-based algorithm for image processing allowed us to describe and monitor changes in intracellular pore-like structures over time. Finally, we tested the possibility of inducing aspects of zone-specific LSEC phenotype and metabolism using culture-based treatments, which resulted in modest shifts in marker expression and metabolic activity. The presented strategy provides an advanced tool kit for investigating liver endothelial cells.
Frontiers in Cell and Developmental Biology, 2025:
https://doi.org/10.3389/fcell.2025.1528991
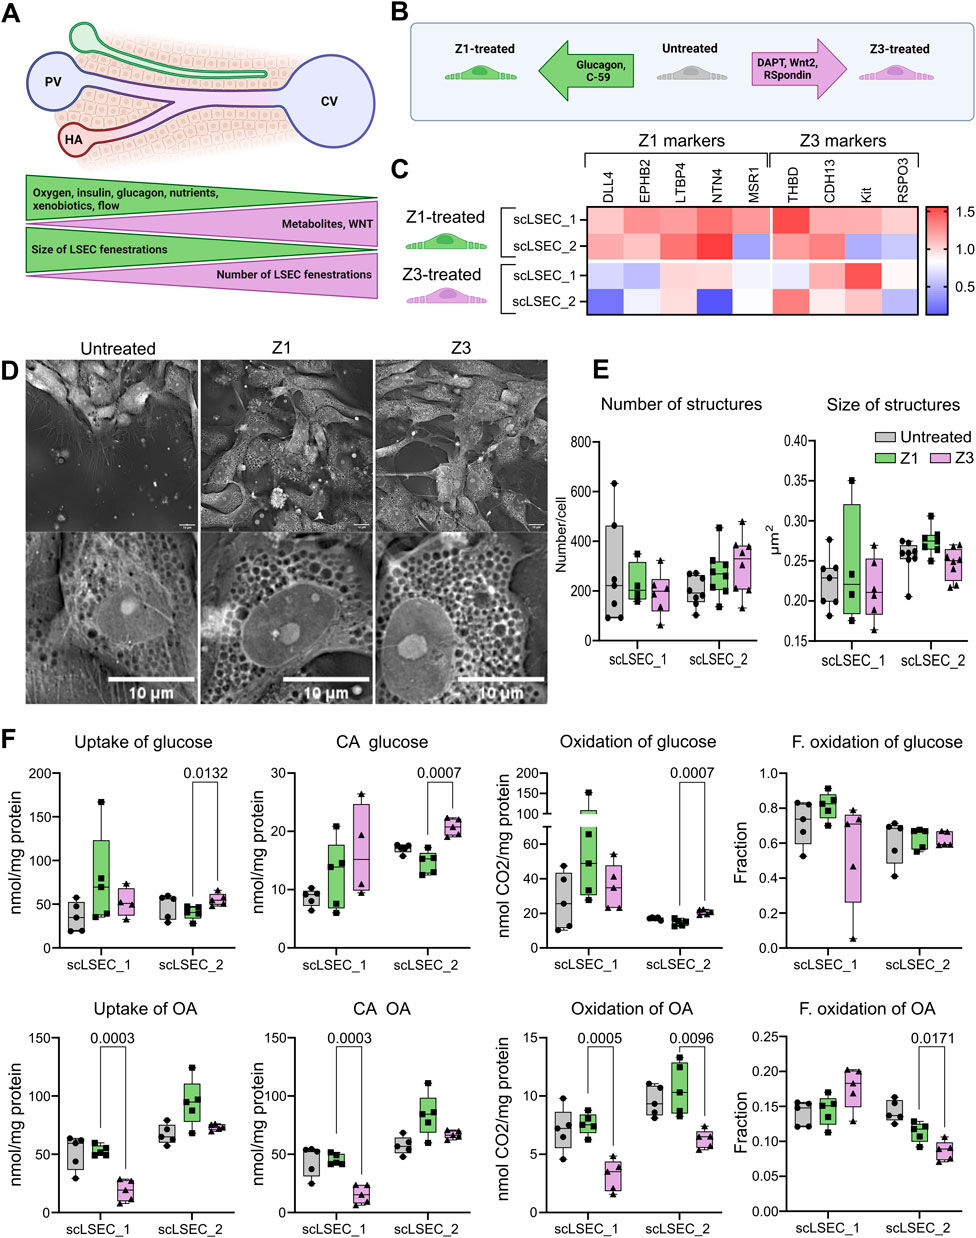
(A) Representation of a liver sinusoid displaying factors driving metabolic zonation, and zone-specific phenotype of LSEC. PV: portal vein, CV: central vein, HA: hepatic artery.
(B) Graphic representation of the experimental conditions tested in this experiment. Z1: Zone 1, Z3: Zone 3.
(C) Heat map of the expression of LSEC markers showing their differential up or downregulation compared to untreated LSECs after 5 days of treatment with Z1 or Z3 inducing cocktails. N = 2-9 replicates from n = 1-3 differentiations per cell line. The relative values are normalized to the untreated condition of each respective cell line.
(D) Representative holotomography images of scLSEC_2 after 5 days of treatment with Z1 or Z3 inducing cocktails and untreated control. Scale bars = 10 μm.
(E) Average number and size of pore-like circular structures detected per cell at day 5 of the treatments. N = 4-8 images. Statistical test: Unpaired t-test with Welch’s correction, comparing Z1 and Z3 for each cell line.
(F) Metabolic activity assessment for glucose and oleic acid (OA) in untreated control scLSECs, and in scLSECs after 5 days of treatment with Z1 or Z3 inducing cocktails showing zone specific differences in OA uptake and oxidation. CA: Cell-associated, F. oxidation: Fractional oxidation. Statistical test: Unpaired t-test with Welch’s correction, comparing Z1 and Z3 for each cell line. N = 5.